require 'narray'
require 'pgplot'
include Pgplot
# set color table
def palett
rl = [-0.5, 0.0, 0.17, 0.33, 0.50, 0.67, 0.83, 1.0, 1.7]
rr = [ 0.0, 0.0, 0.0, 0.0, 0.6, 1.0, 1.0, 1.0, 1.0]
rg = [ 0.0, 0.0, 0.0, 1.0, 1.0, 1.0, 0.6, 0.0, 1.0]
rb = [ 0.0, 0.3, 0.8, 1.0, 0.3, 0.0, 0.0, 0.0, 1.0]
pgctab(rl, rr, rg, rb)
end
# prepare Data
nx = 64
ny = 64
x = NArray.sfloat(nx,1).indgen!(1)
y = NArray.sfloat(1,ny).indgen!(1)
f = NMath.cos( NMath.sqrt(x*(80.0/nx))*0.6 - y*16.0/(3.0*ny) ) *
NMath.cos( x*16.0/(3.0*nx) ) +
(x/nx - y/ny) + NMath.sin(NMath.sqrt(x**2+y**2))*0.05
# draw Image Map
pgopen
pgwnad(0.0, 1.0+nx, 0.0, 1.0+ny)
palett
pgimag(f)
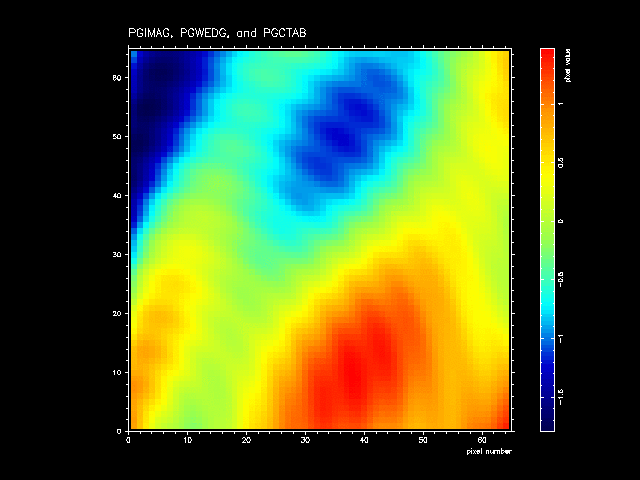
pgmtxt('t',1.0,0.0,0.0,'PGIMAG, PGWEDG, and PGCTAB')
# draw Color Bar at bottom
pgsch(0.6)
pgbox('bcntsi',0.0,0,'bcntsiv',0.0,0)
pgmtxt('b',3.0,1.0,1.0,'pixel number')
pgwedg('RI', 4.0, 5.0, f.min,f.max, 'pixel value')
Ruby/PGPLOT
by Masahiro Tanaka
Last update: May 16 2014