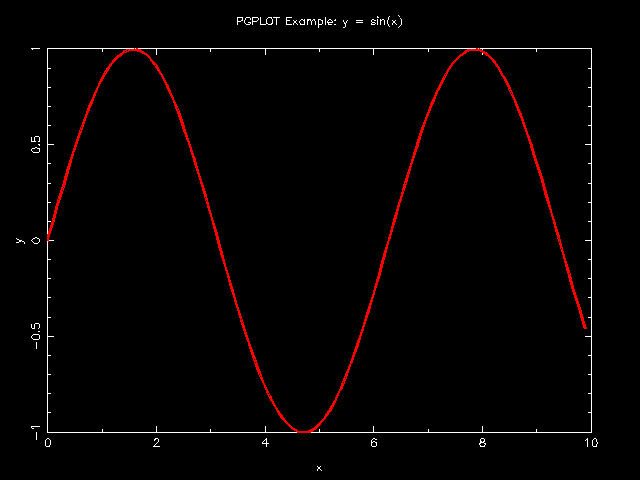
require 'narray'
require 'pgplot'
include Pgplot

n = 100
x = NArray.sfloat(n).indgen!/10
y = NMath.sin(x)

pgopen                 # open PGPLOT session
pgenv 0, n/10, -1, 1   # set "Plotter Environment" and draw box.
pglab "x", "y", "PGPLOT Example: y = sin(x)"
pgsci 2                # set Color Index = Red.
pgslw 5                # set Line Width.
pgline x, y            # plot Line.